Working with the Production Line Graph
Learn how to navigate, organize, and interact with the production line graph canvas.
Overview
The production line graph is where you spend most of your time building and managing data pipelines. This guide covers features that help you work efficiently with complex workflows:
- Navigate and interact with the graph canvas
- Group tasks to reduce visual complexity
- Search and filter tasks using the side panel
- Select multiple tasks and use context menus
- Keyboard shortcuts for common actions
Prerequisites
- Understanding of production lines and tasks (see Production Lines)
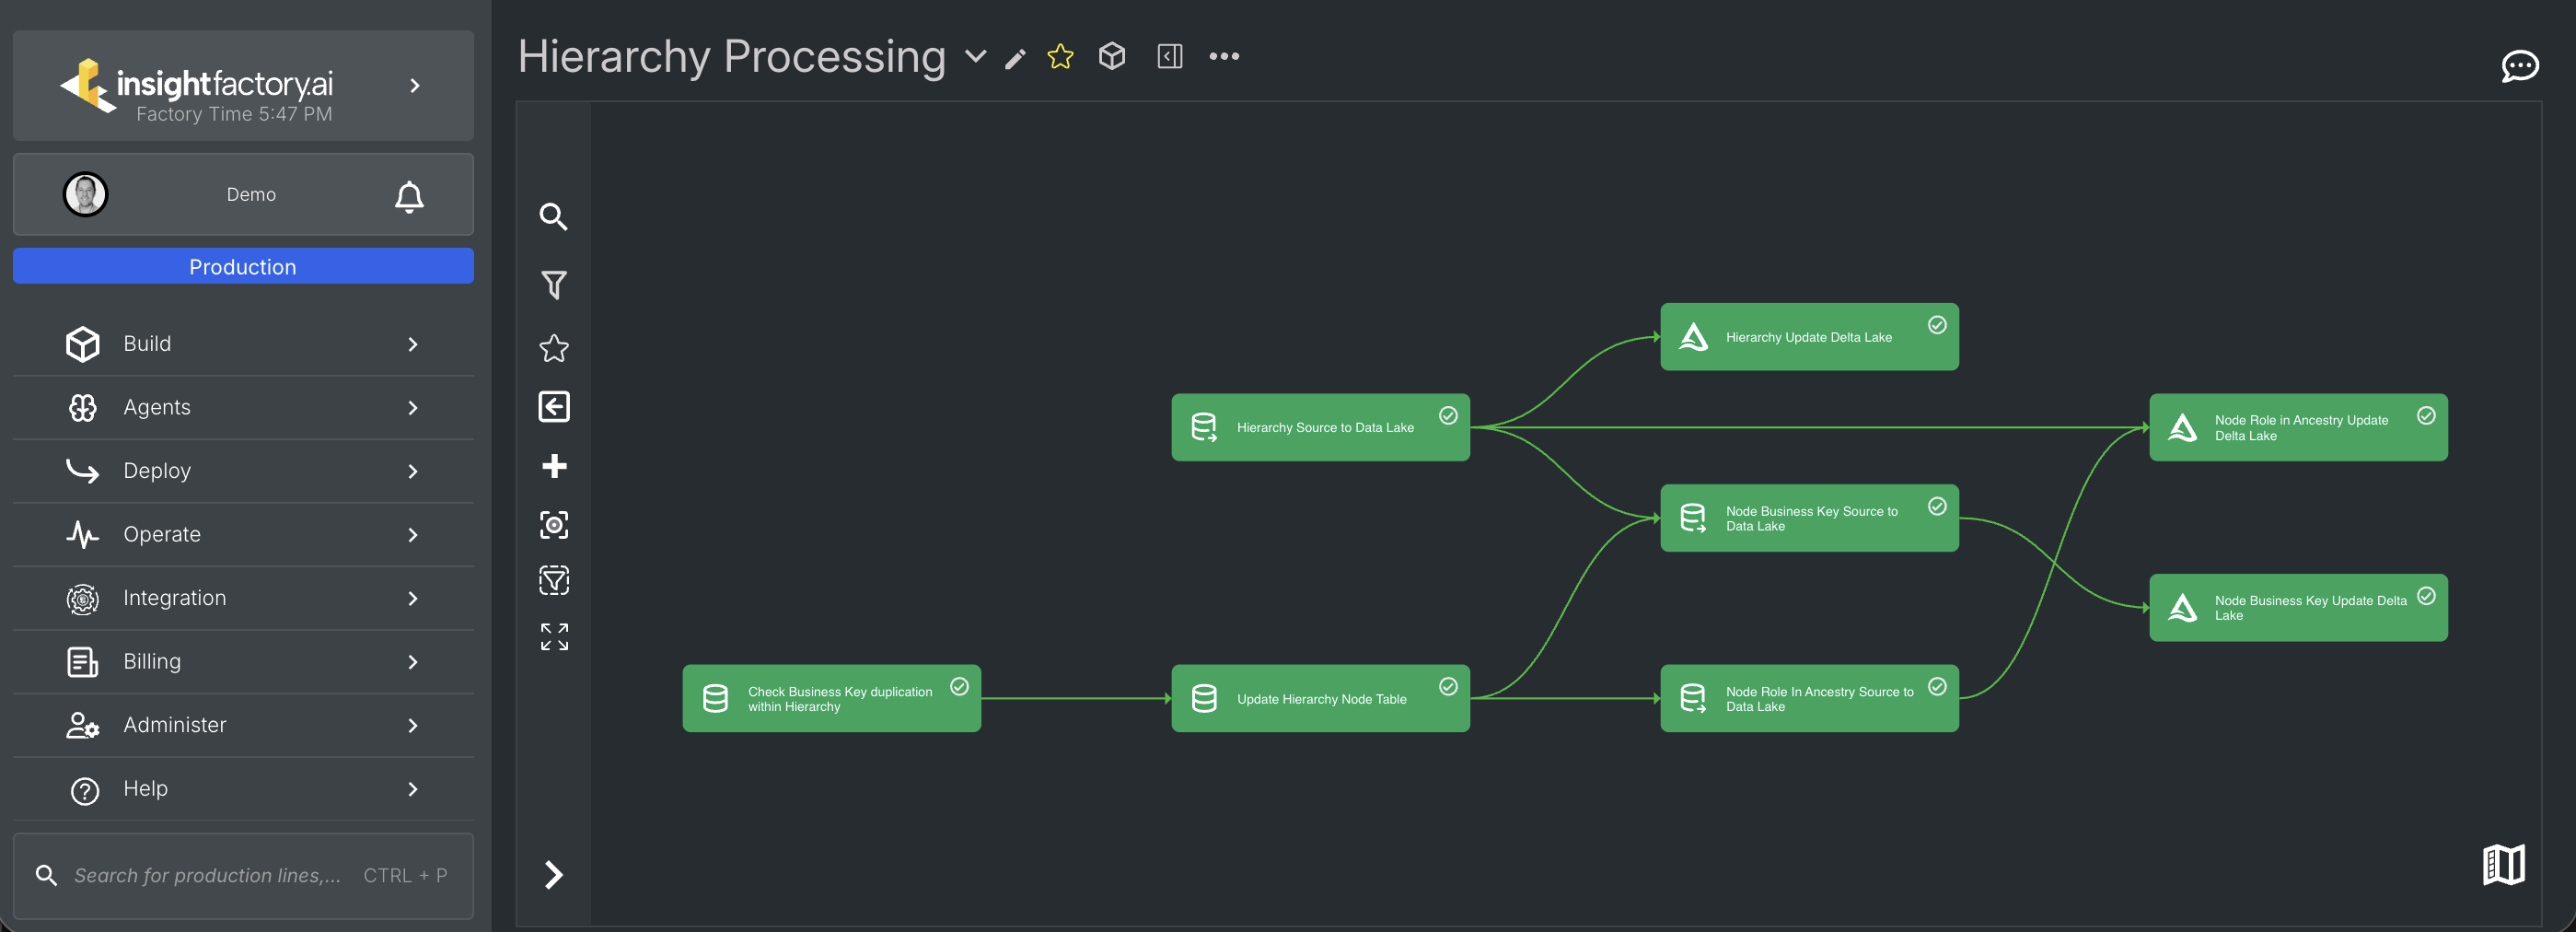
The Graph Canvas
The graph canvas displays your tasks as nodes connected by dependency lines. Tasks flow from left to right, with upstream dependencies on the left and downstream tasks on the right. Task nodes are colour-coded by run status. See Task Run Statuses for a reference of all colours and icons.
Navigation
- Pan: Click and drag on empty canvas space to move around
- Zoom: Use the mouse scroll wheel or pinch gesture to zoom in/out
- Fit to view: Use the graph menu to reset the view
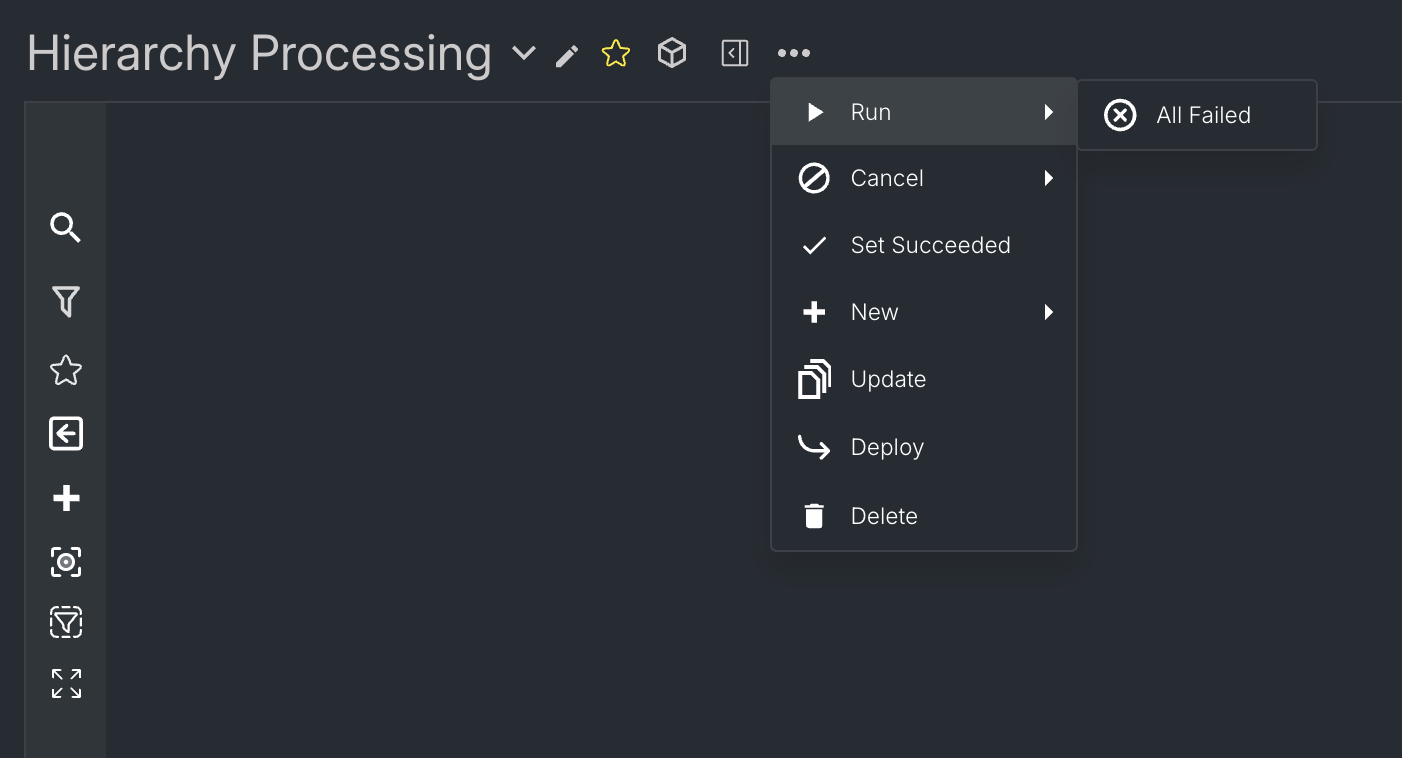
The Graph Menu
The graph menu appears in the top bar near the production line name. Click the three-dot menu icon to access options for running, cancelling, updating, and deploying the production line.
Grouping tasks
When production lines grow large, you can collapse related tasks into groups to simplify navigation. See Grouping Tasks for details on creating and managing groups.
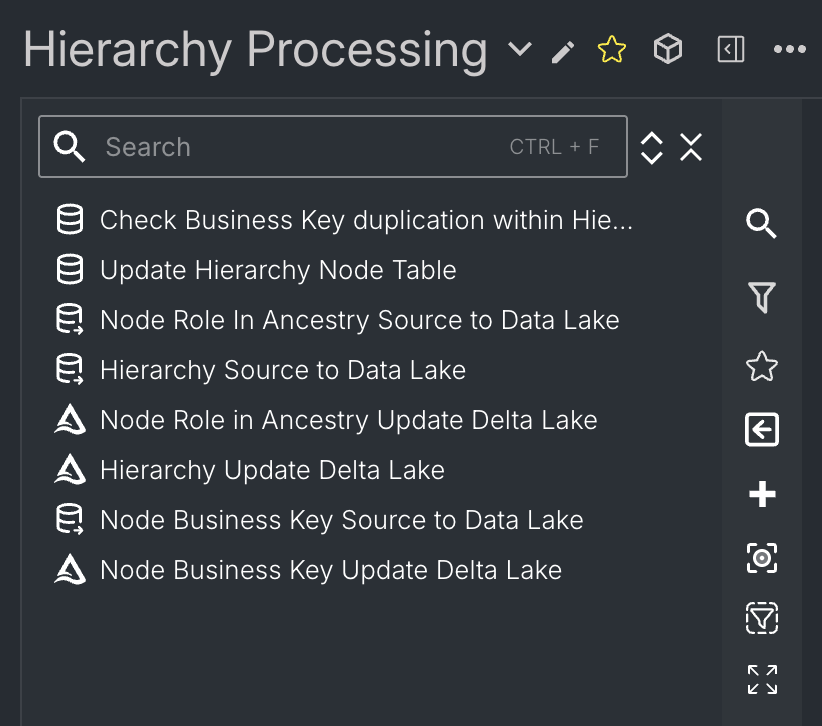
Using the Side Panel
The side panel provides search and filter capabilities for locating tasks in large production lines.
Opening the side panel
Press Ctrl+F (or Cmd+F on Mac) to open the side panel, or click the search icon in the toolbar.
Searching for tasks
Type a task name or partial match in the search box. The panel shows matching tasks and highlights them on the graph.
Filtering tasks
Use filters to narrow down tasks by:
- Task status
- Activity type
- Task group membership
Click a task in the search results to navigate to it on the graph.
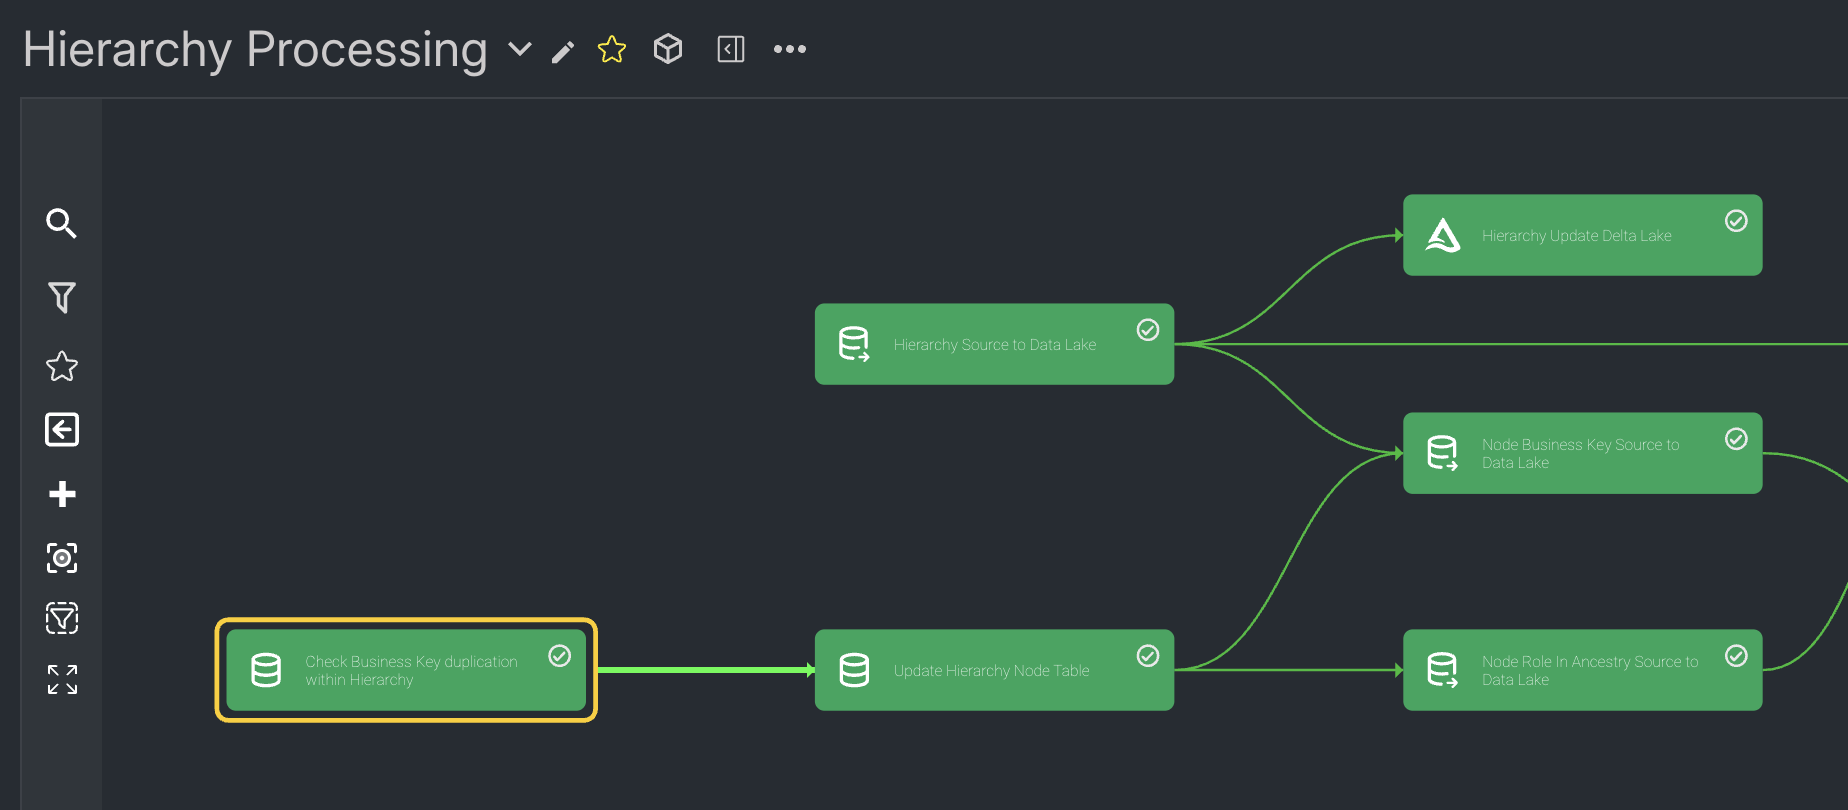
Selecting tasks
Single selection
Click on a task node to select it. The selected task is highlighted with a gold border.
Multi-Selection
Hold Shift and click additional tasks to add them to your selection. Selected tasks are highlighted together.
You can also:
- Shift+click on a range of connected tasks
- Use the side panel to select multiple search results
Multi-selection enables bulk operations through the context menu.
Context Menus
Right-click on tasks to access context menus with available actions.
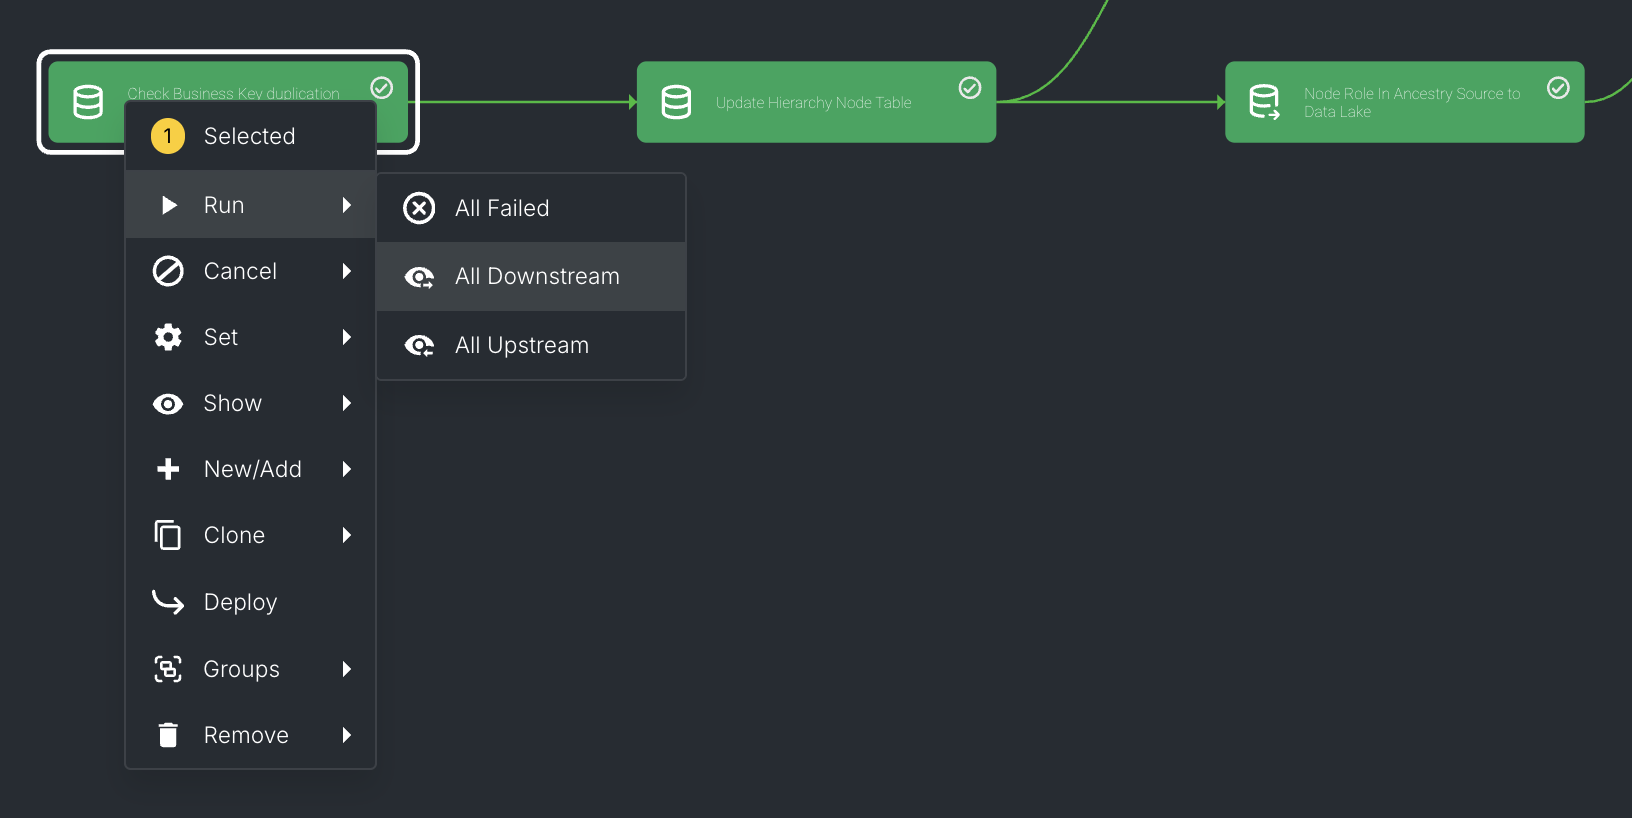
Task context menu options
Right-clicking a task shows options including:
- Run: Execute the task
- Cancel: Stop a running task
- Set: Configure task settings
- Show: Display related items (upstream/downstream tasks)
- Clone: Duplicate the task
- Notebook: Open the associated Databricks notebook
- Deploy: Deploy the task to another environment
- Groups: Add to or remove from task groups
- Remove: Delete the task from the production line
Keyboard Shortcuts
| Shortcut | Action |
|---|---|
| Ctrl+F | Open side panel / Search |
| Delete | Delete selected task(s) |
| Escape | Deselect all |
| Ctrl+A | Select all tasks |
Tips for organizing complex graphs
- Use groups strategically: Group tasks by workflow stage (ingestion, transformation, output) or by data domain
- Name tasks descriptively: Clear names make searching and navigation easier
- Use the side panel: For production lines with 20+ tasks, the side panel is faster than visual scanning
- Collapse completed sections: When iterating on one part of a pipeline, collapse stable sections to reduce visual noise