v6.2 Release Notes
Here's what's new in version 6.2.
New Features
Improved Notifications
We're working hard to deliver a better notification experience. In this release, we've added the ability to subscribe to email notifications for success and failure events for individual Production Lines or Tasks. If you subscribe to be notified of the success of a Production Line run, you will only receive an email notification once the last Task is successful in that Production Line run, provided that all other Tasks have been successful in that same Production Line run.
Graph Developer Mode
Previously, graphs were only available in a single mode, which we're now calling Monitor mode. We've now introduced a new mode called Developer mode.
In Developer mode, the following graph enablement occurs:
- Where a Task updates a Delta Table, the name of that Delta Table replaces the Task Code shown below the Task Name on the Task tile.
- Where a Task is associated with a Databricks Notebook, and the path to that Notebook is not a folder considered a 'published' location, an additional panel will display beneath the Task tile to indicate which User has the Notebook 'checked out.'
The Task context menu presents more options for other actions you can take directly from the Task tile:
- View Table - navigates directly to that Table info screen in Databricks.
- Notebook > Checkout - allows the User to modify the path to the Notebook to their own Repo folder. This does not copy the Notebook to this new path; the User is expected to do this via other means.
- Notebook > Publish - changes the Notebook path back to the 'published' location. This does not perform any action in the git repo; the User is expected to do this via other means.
- Notebook > View - navigates directly to the Notebook path in Databricks.
This mode (and possibly others) will be expanded in the coming releases.
Notebook Checkout & Publish
Users can now batch 'checkout' notebooks to their own repo as well as 'publish' notebooks. Behind the scenes, this is simply updating notebook paths to point to a specific user repo or the 'Published' repo. This saves having to do this one by one, an extremely tedious task even for small batches.
Global Search
A global search box has been added to the top bar. This allows you to easily search across Production Lines, Tasks, Task Groups, and more to quickly find items matching your keyword. Each item returned contains a link to take you straight to that item.
Clone Production Lines, Task Groups, and Schedules
Just like you've been able to clone Tasks for quite some time, we've now added the ability to clone a Production Line, Task Group, or Schedule. Additionally, when cloning a Production Line, we've enabled the ability to clone all Tasks within that Production Line too. This may be useful in testing scenarios when you want to perform what-if analyses.
Updated Select Lists
You'll now see standardised select lists across the application. Most lists allow you to quickly filter by typing a few characters, which greatly improves the selection speed.
Concurrency Thresholds
Previously only available via our API, Concurrency Thresholds can now be created and modified via the UI. Concurrency Thresholds allow developers to throttle tasks at the Task Group level, which is important for controlling the number of tasks that can concurrently hit a Databricks cluster or Data Factory Integration Runtime. A Concurrency Threshold select list has been added to both the Task and Task Group metadata tabs.
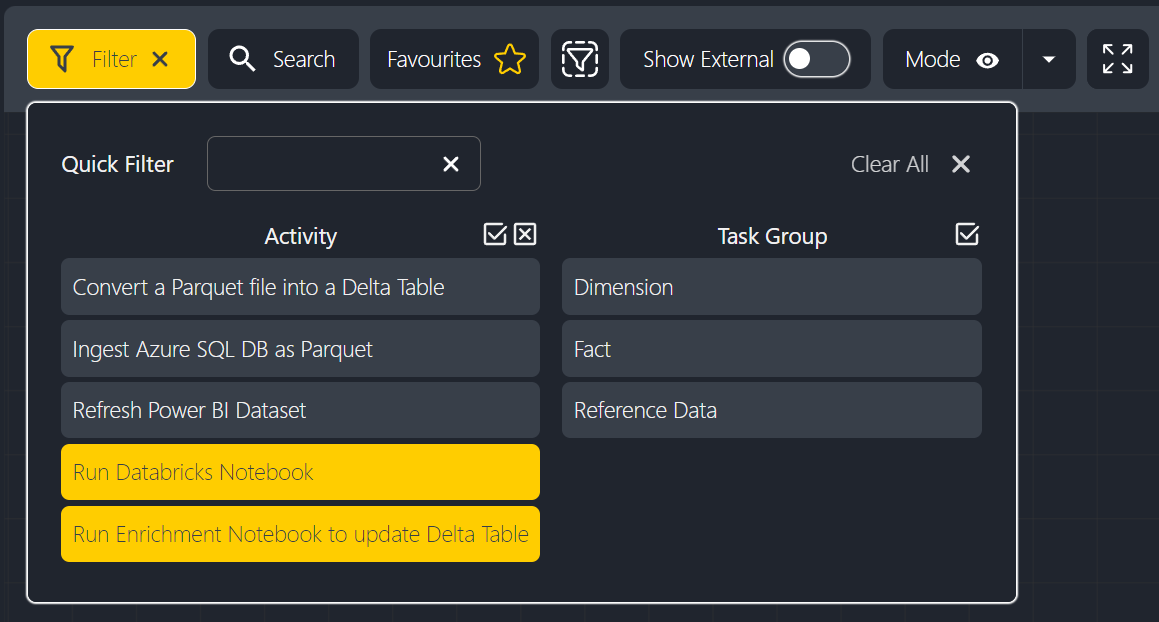
Improved Filtering
The filter panel has been improved with two new features. First, a new textbox allows users to quickly find the item they're interested in. Second, new 'select all' and 'deselect all' buttons above each list allow for quicker manipulation of filters. For instance, it's common to want to select all but a certain item, so now users can select all and unselect one or more items.
Enhancements
- Allow run/cancel upstream/downstream for multiple graph nodes.
- Allow for keyword filtering within the Logs tab.
- Allow users to refresh Databricks folders or repos both recursively and non-recursively.
- Allow users to favourite Schedules and filter by their favourites.
- Tasks are now properly validated before they can be saved.
- Add more hotkey support. Users can now use Ctrl+F to open the keyword search and Ctrl+A to select all filtered graph nodes.
- Add more filtering to the Production Line table. You can now also filter by Tag or Run Status.
- Add a new Runs tab to the Production Line panel.
- Add more columns to Production Line and Task tables.
- Allow users to quickly navigate to notebooks or Databricks tables via the context menu.
Bug Fixes
- Fix issue preventing new users from being invited to an Insight Factory.
- Prevent duplicate 'Recently Viewed' items appearing on the home screen.
- Prevent the Search filter, particularly for Tasks, from dropping typed letters.
- Fix issue with the notebook diff viewer displaying the wrong colours.
- Fix issue where pressing Escape would clear all filters.
New Activities
- Ingest from SAP HANA Database to Data Lake
- Copy data from an SAP HANA database into the Lakehouse raw zone in Parquet format. A self-hosted Integration Runtime is mandatory for this Activity.
- Ingest from IBM DB2 Database to Data Lake
- Copy data from a DB2 database into the Lakehouse raw zone in Parquet format. If your data store is a managed cloud data service, you can use the Azure Integration Runtime. If the access is restricted to IPs that are approved in the firewall rules, a self-hosted Integration Runtime is required.
Decommissioned Features
Eagle-eyed users will notice the 'Show Inactive' toggle on the Tasks page has been removed. This change was made to improve the filtering experience because Inactive is available within the Filter panel.